How to use the EEI
Matrix and numerical scoring systems of EEI
1. The original EEI:
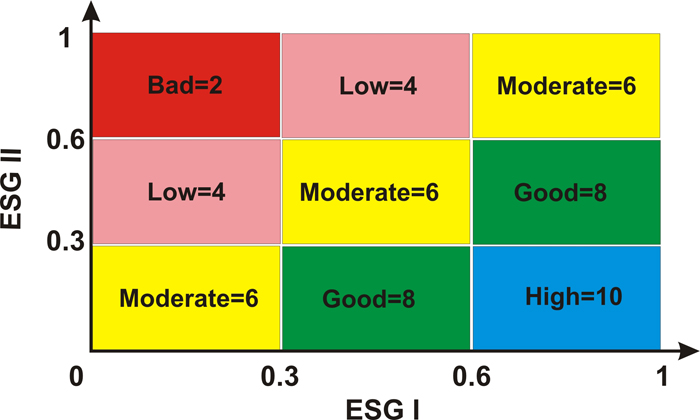
The absolute abundance (% coverage) of ESG I=[(IA*1)+(IB*0.8)+(IC*0.6)] and ESG II =[(IIA*0.8)+(IIB*1)] are cross compared in a matrix to determine the Ecological Status Class (ESC) of a sample in a range of five classes from high to bad.
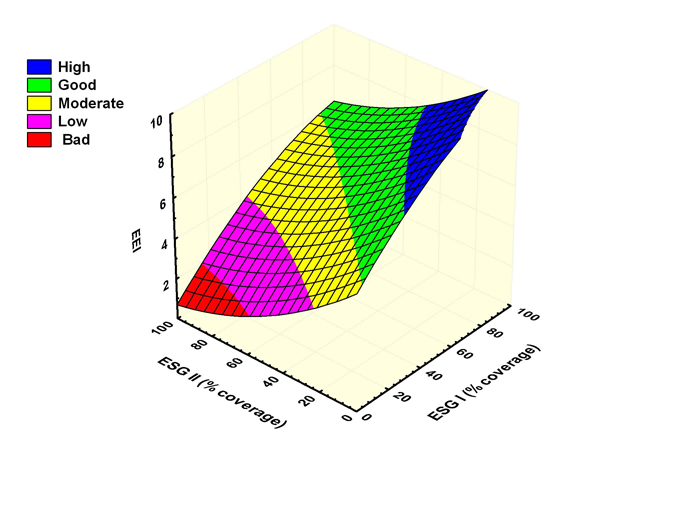
A numerical scoring system corresponds the ESC in a numerical value, the EEI. A hyperbolic model approximates the index values and expresses the ecosystem status in continuous numbers as following:
p(x,y) = a + b*(x/100) + c*(x/100)2 + d*(y/100) + e*(y/100)2+ f*(x/100)*(y/100)
a = 0.4680 b = 1.2088 c = - 0.3583
d = - 1.1289 e = 0.5129 f = - 0.1869
2. The EEI can be transformed in accordance to the Ecological Quality Ratios of WFD:
EEIEQR=1.25x(EEIvalue/RCvalue)-0.25, RC=10
EEIEQR values for coastal waters in Greece higher than 0.48 (±0.09SD) indicate sustainable ecosystems of good or high ESC, whereas EEI values lower than 0.48 indicate that the ecosystems should be restored to a higher ESC.
A water quality assessment at Km's scale
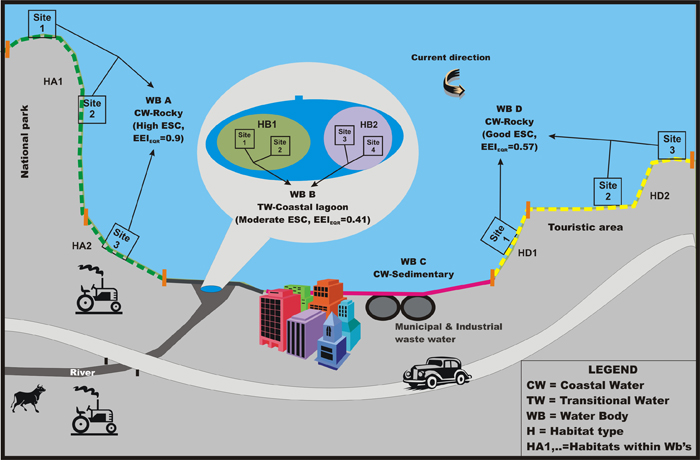
A hypothetical coastal zone was divided into four water bodies (WB): two coastal (A, D) with hard substrata, one coastal ( C) and one transitional (B) with a sedimentary substratum (see Figure).
The EEI can be applied in shallow (depth<1m) and vegetated (% coverage>10%) sites of the rocky coastal and sedimentary transitional (salinity>10psu) WBs.
Within WB A, two coastal lines inhabited by different habitat types (HA1, HA2) were identified covering an area of 70 and 30%, respectively. In each habitat one or more permanent sites (10 m x 10 m; length x width), apart by a distance of kilometres, with a well-developed (climax) macrophyte community were selected. At each site three random samples (25 cm x 25 cm; length x width) were taken two or more times a year in different seasons (preferably not in winter). The mean absolute coverage (%) of ESGs IA, IB, IC, IIA and IIB of a site sample of HA1 was 80, 40, 30, 15 and 5, respectively. By using the EEI continuous formula this corresponded to high ESCs (EEI=10):
ESG I=(80x1)+(40x0.8)+(30x0.6)=130, ESG II=(15x0.8)+(5x1)=17
The average EEI value for all site samples was 9.8. Similarly, the average EEI value of all site samples of HA2 was 7.8. The overall ESC of WB A was (9.8x0.7)+(7.8x0.3)=9.2, which corresponded to a high ESC and to EEIEQR=0.9, reference conditions EEI=10. The ESC of WB D was similarly estimated.
Within WB B, a coastal lagoon, two habitat types (HB1, HB2) were identified covering an area of 40 and 60% of the coastal lagoon, respectively. In each habitat at least two permanent sites (15 m x 15 m; length x width), apart by a distance of kilometres, with a well-developed macrophyte community were selected. At each site four to five random samples (box corer; 17 cm x 17 cm × 15 cm; length × width × height) were taken once a year during summer. The mean absolute coverage (%) of ESGs IA, IB, IC, IIA and IIB in a site sample of HB1 was 60, 10, 10, 35 and 10, respectively. By using the EEI continuous formula this corresponded to good ESCs (EEI=8.07):
ESG I=(60x1)+(10x0.8)+(10x0.6)=74, ESG II=(35x0.8)+(10x1)=38
The average EEI value for all samples was 7.6. Similarly, the average EEI value of all site samples of HB2 was 3.8. The overall ESC of the coastal lagoon was (7.6x0.4)+(3.8x0.6)=5.3, which corresponds to moderate ESC and to EEIEQR=0.41, reference conditions EEI=10.